Data Pipeline by xkcd.com
In a previous post we explored a method for performing continuous aggregation on a stream of sensor readings using the Kafka Streams DSL. This time I want to share with you kafka-streams-pipeline, a Kafka Streams application that leverages said continuous aggregation method and defines a complete stream processing pipeline, which enables querying the continuous data summaries stored into a materialized KTable, by incorporating the spatial and temporal dimensions of the sensor data to the analysis. To understand how this application works, let’s first get back to the temperature-readings topic from the previous post. In this topic the feed of temperature measurements made by multiple sensors is being posted. The following is an excerpt of the measurements registered in temperature-readings:
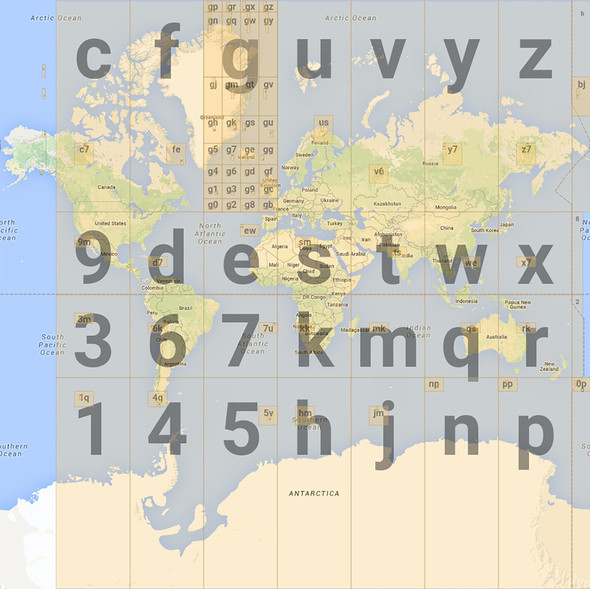
Each JSON object from the list above represents a temperature reading taken by a given sensor. Notice the timestamp and geohash fields, which hold the information about the time and the location of each measurement. In case you are not familiar with the concept of geohashing, it is basically an encoding mechanism created by Gustavo Niemeyer in 2008, that allows reducing a two-dimensional longitude, latitude pair into a single alphanumeric string (in base32 format), where each subsequent character adds precision to the location. So, for instance, the geohash u155mz82dv33 corresponds to the longitude, latitude pair (4.47189873, 51.23760204). The idea is to enable interactive (low-latency) queries that support typical visual exploratory analysis tasks on top of the spatiotemporal data being posted to temperature-readings, by leveraging some appealing features of geohashes such as its inherent hierarchical structure, which recursively subdivides geospatial areas into 32 cells or tiles at each level (character)1, as you can see in the diagram below.

Geohashes by Movable Type Scripts
This way, by truncating the geohash of each of the incoming readings to a certain number characters, we can set up a grid for partitioning the temperature data in the spatial dimension, and perform continuous aggregation on each of the resulting partitions. The same principle can be applied in the temporal dimension by truncating the timestamp of each reading to a certain unit of time, laying out a temporal partitioning schema that arranges data into time bins of a fixed width (for instance, minutely, hourly, or daily bins).
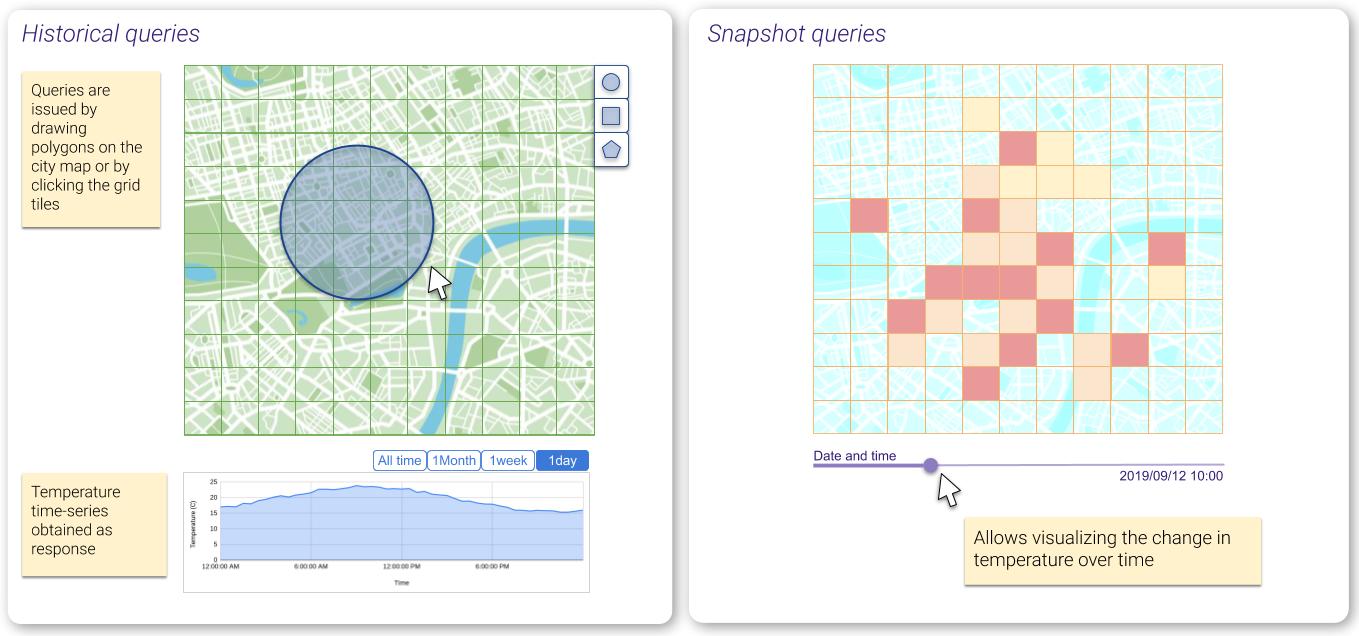
The application focuses on serving two types of queries: (1) Historical queries, namely those asking how the temperature has evolved along a given geospatial region, over a certain period of time; and (2) Snapshot queries which provide a time-slice view of the temperature for a specific moment in time.

Historical and Snapshot queries
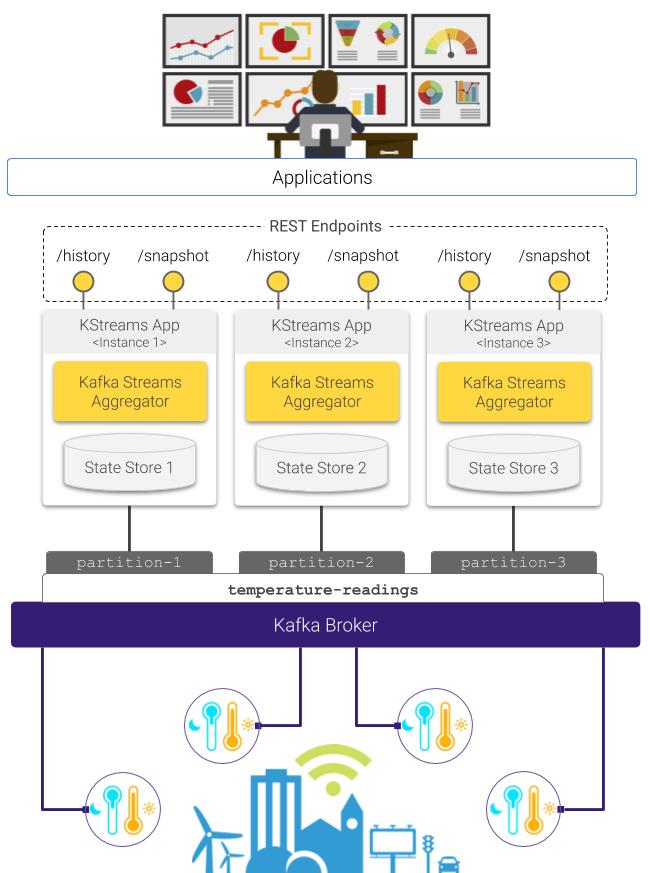
Below you can see a schematics showing the structure of the stream processing pipeline at the core of the application discussed in this post.

Stream processing pipeline for interactive querying with Kafka Streams
As you can see in the diagram above, it is possible to deploy multiple stream processors, each one hosting an instance of the state store where one fraction of the global application state is persisted. In consequence, in this distributed setup queries are computed by combining the result sets obtained from each processor:

Distributed query resolution
The source code of this application is available on github. You can deploy the entire pipeline (including an application for generating syntethic temperature values, discussed in a recent post) on your local machine using Docker. Just clone the repository and follow the instructions on the README.md file. Hope you find it useful! :)